
Most spreadsheets in the world are terrible (even if functional); below you will find some useful spreadsheets which have been formatted with attention to detail and visual appeal.

Track the progress of European football teams through the 2024 UEFA Euros on this gorgeous (and free) interactive tracker. All the teams are inputted, along with emoji national flags, and grouped. The group fixtures have been inputted and dated. All you need to do is track the scores of each match and sort the table using the existing sorting rule (points and goal difference). The teams then automatically propagate into the final sixteen table according to the tournament rules (e.g. Winner A versus Runner up B) - this happens once a group has completed all of their matches. Continue to track match scores in the finals tables and watch the teams propagate through the knock out stages automatically… all the way to the final! Once all games are scored the top four table is populated (automatically of course).
This tracker takes things to the next level beyond the World Cup Tracker (below) since the final sixteen rules are more complicated in the Euros. Building them into a spreadsheet was a challenge and you'll be able to see the inner workings in the download. In the Group matches table there are new columns to track yellow 🟨 and red 🟥 cards since these influence the disciplinary points which affect third place sorting. An additional sorting rule to apply on the third place teams to select which of them go through to the final sixteen is included in a new sheet called "Group Stage Runner Ups".
I'm going to enjoy tracking Euros this year; I hope you will too.
This is a Numbers Spreadsheet ¹
Licence: Attribution-NonCommercial-ShareAlike 4.0 International (CC BY-NC-SA 4.0)
DOWNLOAD UEFA Euros Chart 2024
Updated 25/06/2024 - Corrected team selection for Austria and group ordering
Updated 27/06/2024 - Somehow an incorrect symbol got into "Opponent Mapping" table instead of a "D". So I fixed that and now third place selection works. Spotted a mis-mapping in team placement in group (POL and GEO). And for some reason two first place teams face off in next round. Don't know why that is but have adjusted the mapping.
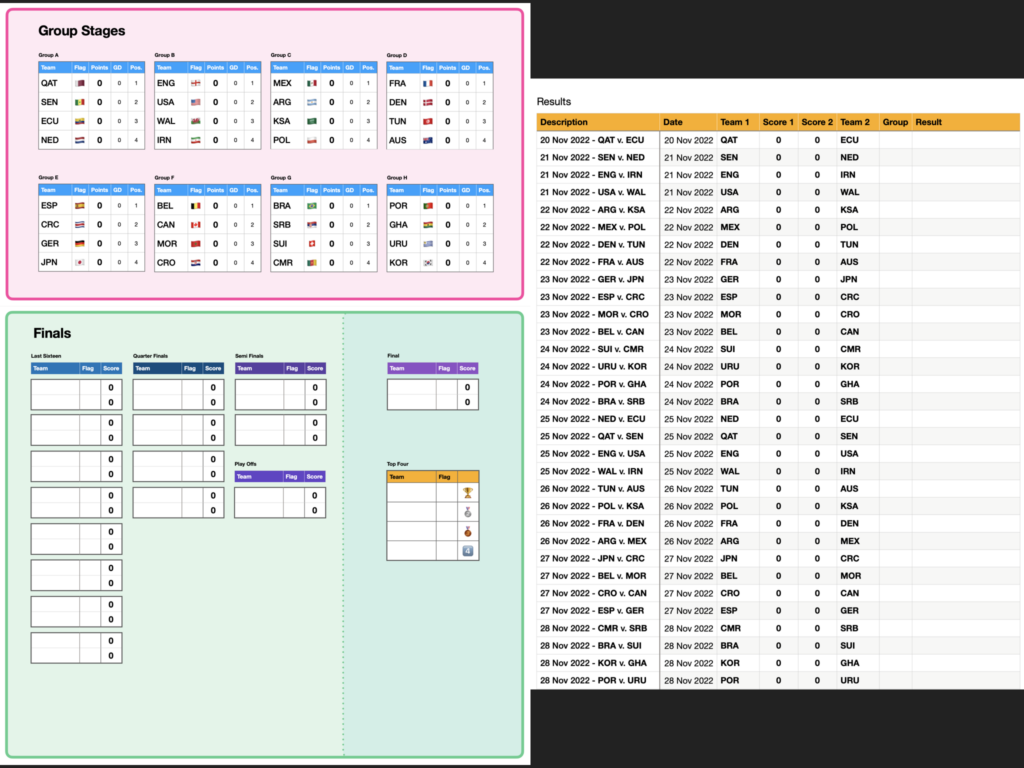
Track the progress of international football teams through the 2022 FIFA World Cup on this gorgeous (and free) interactive chart. All the teams are inputted, along with emoji national flags, and grouped. The group fixtures have been inputted and dated. All you need to do is track the scores of each match and sort the table using the existing sorting rule (points and goal difference). The teams then automatically propagate into the final sixteen table according to the tournament rules (e.g. Winner A versus Runner up B) - this happens once a group has completed all of their matches. Continue to track match scores in the finals tables and watch the teams propagate through the knock out stages automatically… all the way to the final! Once all games are scored the top four table is populated (automatically of course).
I'm going to enjoy tracking world cup this year; I hope you will too.
This is a Numbers Spreadsheet ¹
Licence: Attribution-NonCommercial-ShareAlike 4.0 International (CC BY-NC-SA 4.0)
DOWNLOAD World Cup Chart 2022
Updated 29/11/2022 - Selection into Last 16 fixed (adding GF and GA columns changed lookup column)
Updated 23/11/2022 - Goals For and Goals Against now trackable in Group Stages and table sorting rules incorporate this.
Updated 20/11/2022 - GD sorting rules fixed
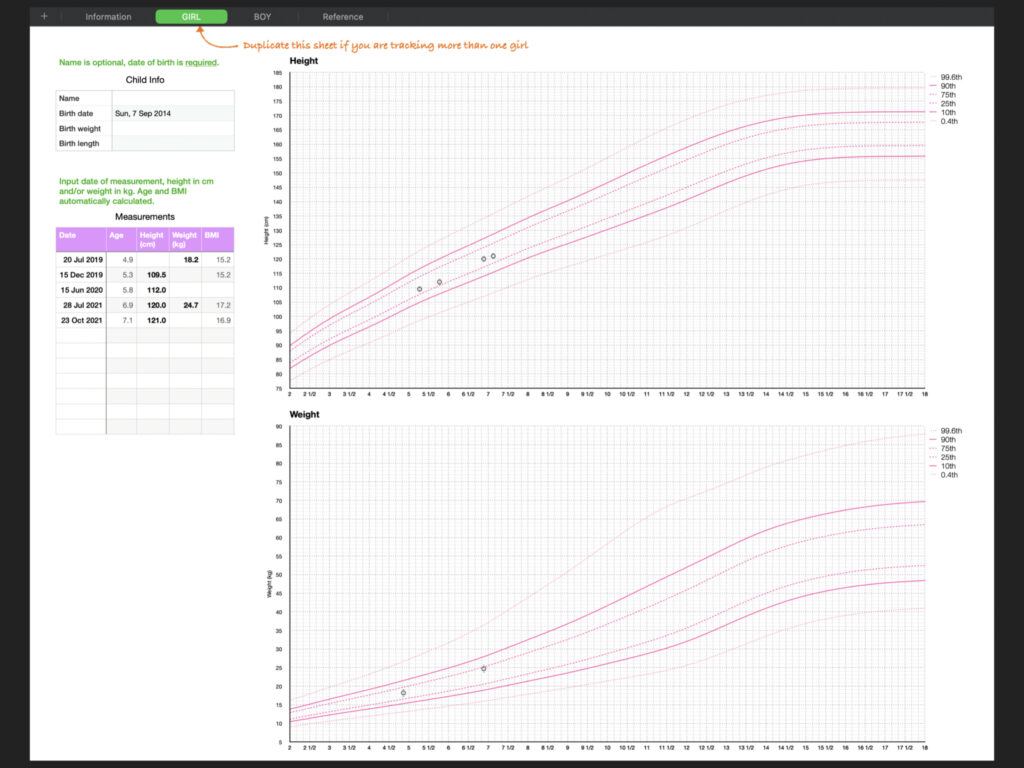
Many parents and health professionals track child growth (height, weight and BMI) on paper charts. I decided to digitise the child growth charts used in the UK as part of the NHS child measurement initiative to help make tracking more reliable and considerably easier for data entry. This spreadsheet includes height, weight and BMI centiles from the WHO in reference tables for children aged 2-18 years. One input table records static child information such as name and date of birth. A second input table is for recording measurements. Height and/or weight are recorded with the date of measurement. BMI is calculated for corresponding height and weight measurements or the nearest pairing for when height and weight are not measured on the same date.
Pairs of overlapping graphs (charts) display the centiles graphically in the background with the actual child measurements plotted in the foreground so their position relative to the centiles can be seen. One pair of charts is for height, another pair for weight and a final pair for BMI.
The measurement tracker includes one sheet for girls and one sheet for boys with their respective reference tables. In order to track multiple girls or boys duplicate the respective sheet.
More information about this UK Growth Charts:
Royal College of Paediatrics and Child Health information about UK Growth Charts
This is a Numbers Spreadsheet ¹
DOWNLOAD Child Measurement Tracker
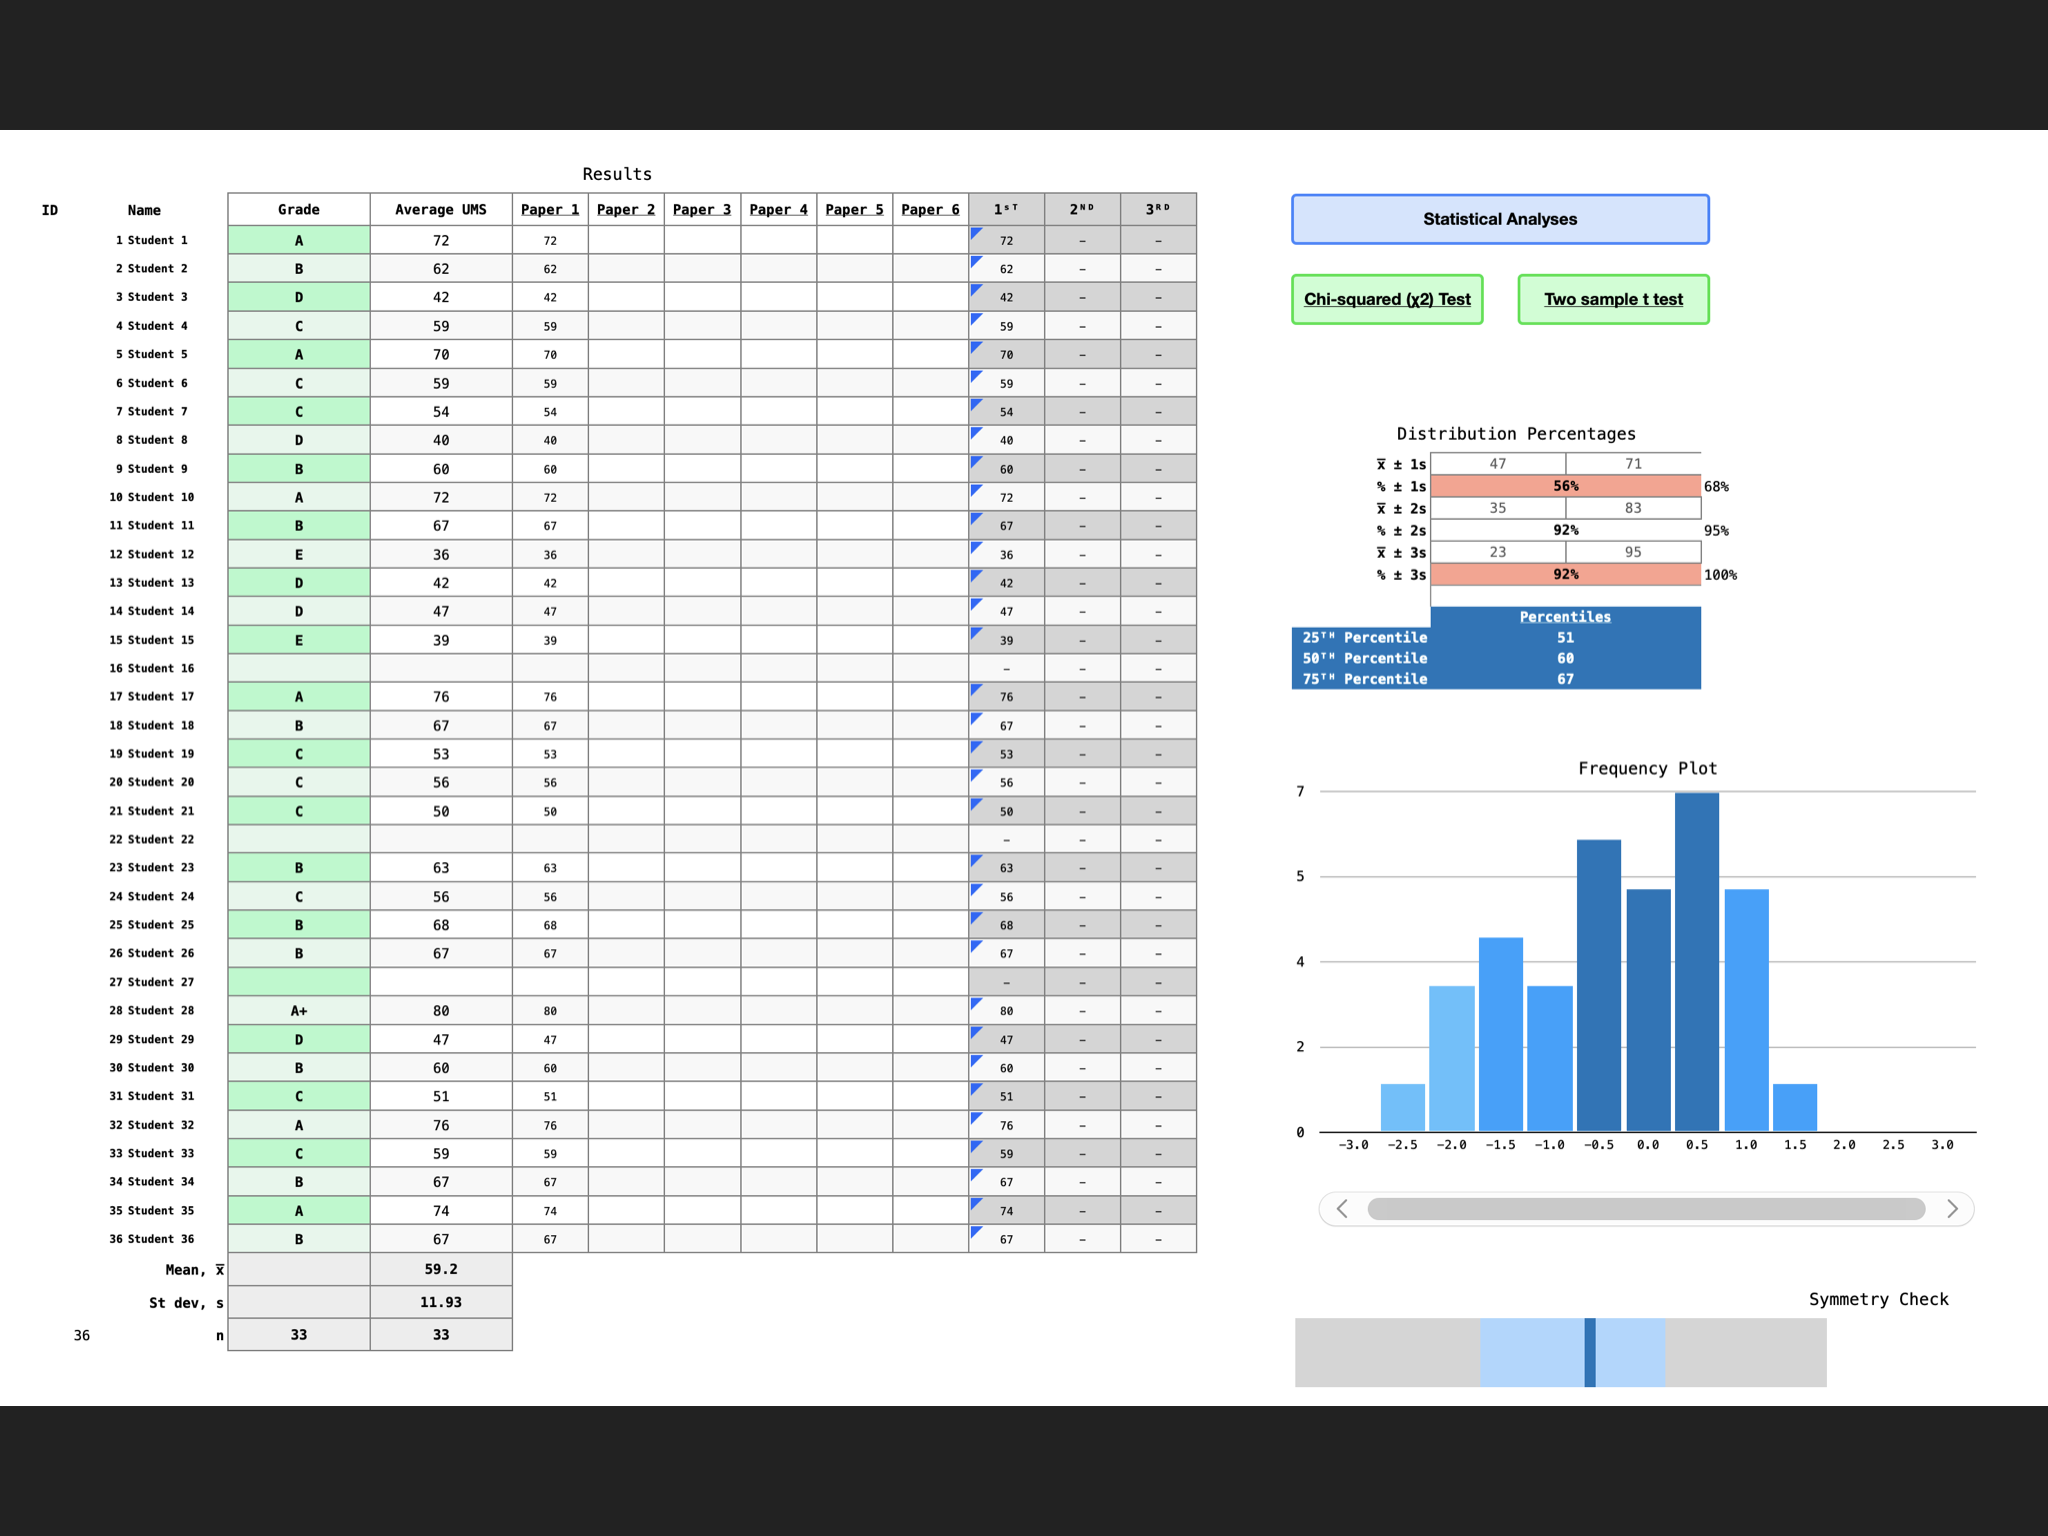
This Numbers ¹ spreadsheet helps teachers grade students across multiple assessments. This is particularly useful for awarding centre assessed grades (CAGs).
The spreadsheet accomplishes the following tasks:
There are some brief instructions written into the Overview sheet and Paper 1 sheet to enable you to get started quickly.
This version supports up to 50 students, six assessments (six papers), it selects the top three results. If you’re comfortable making changes to formulae you are welcome to do so. If you do make changes you are free to give away your changed version but not for sale.
DOWNLOAD UMS Grade Boundary Tool
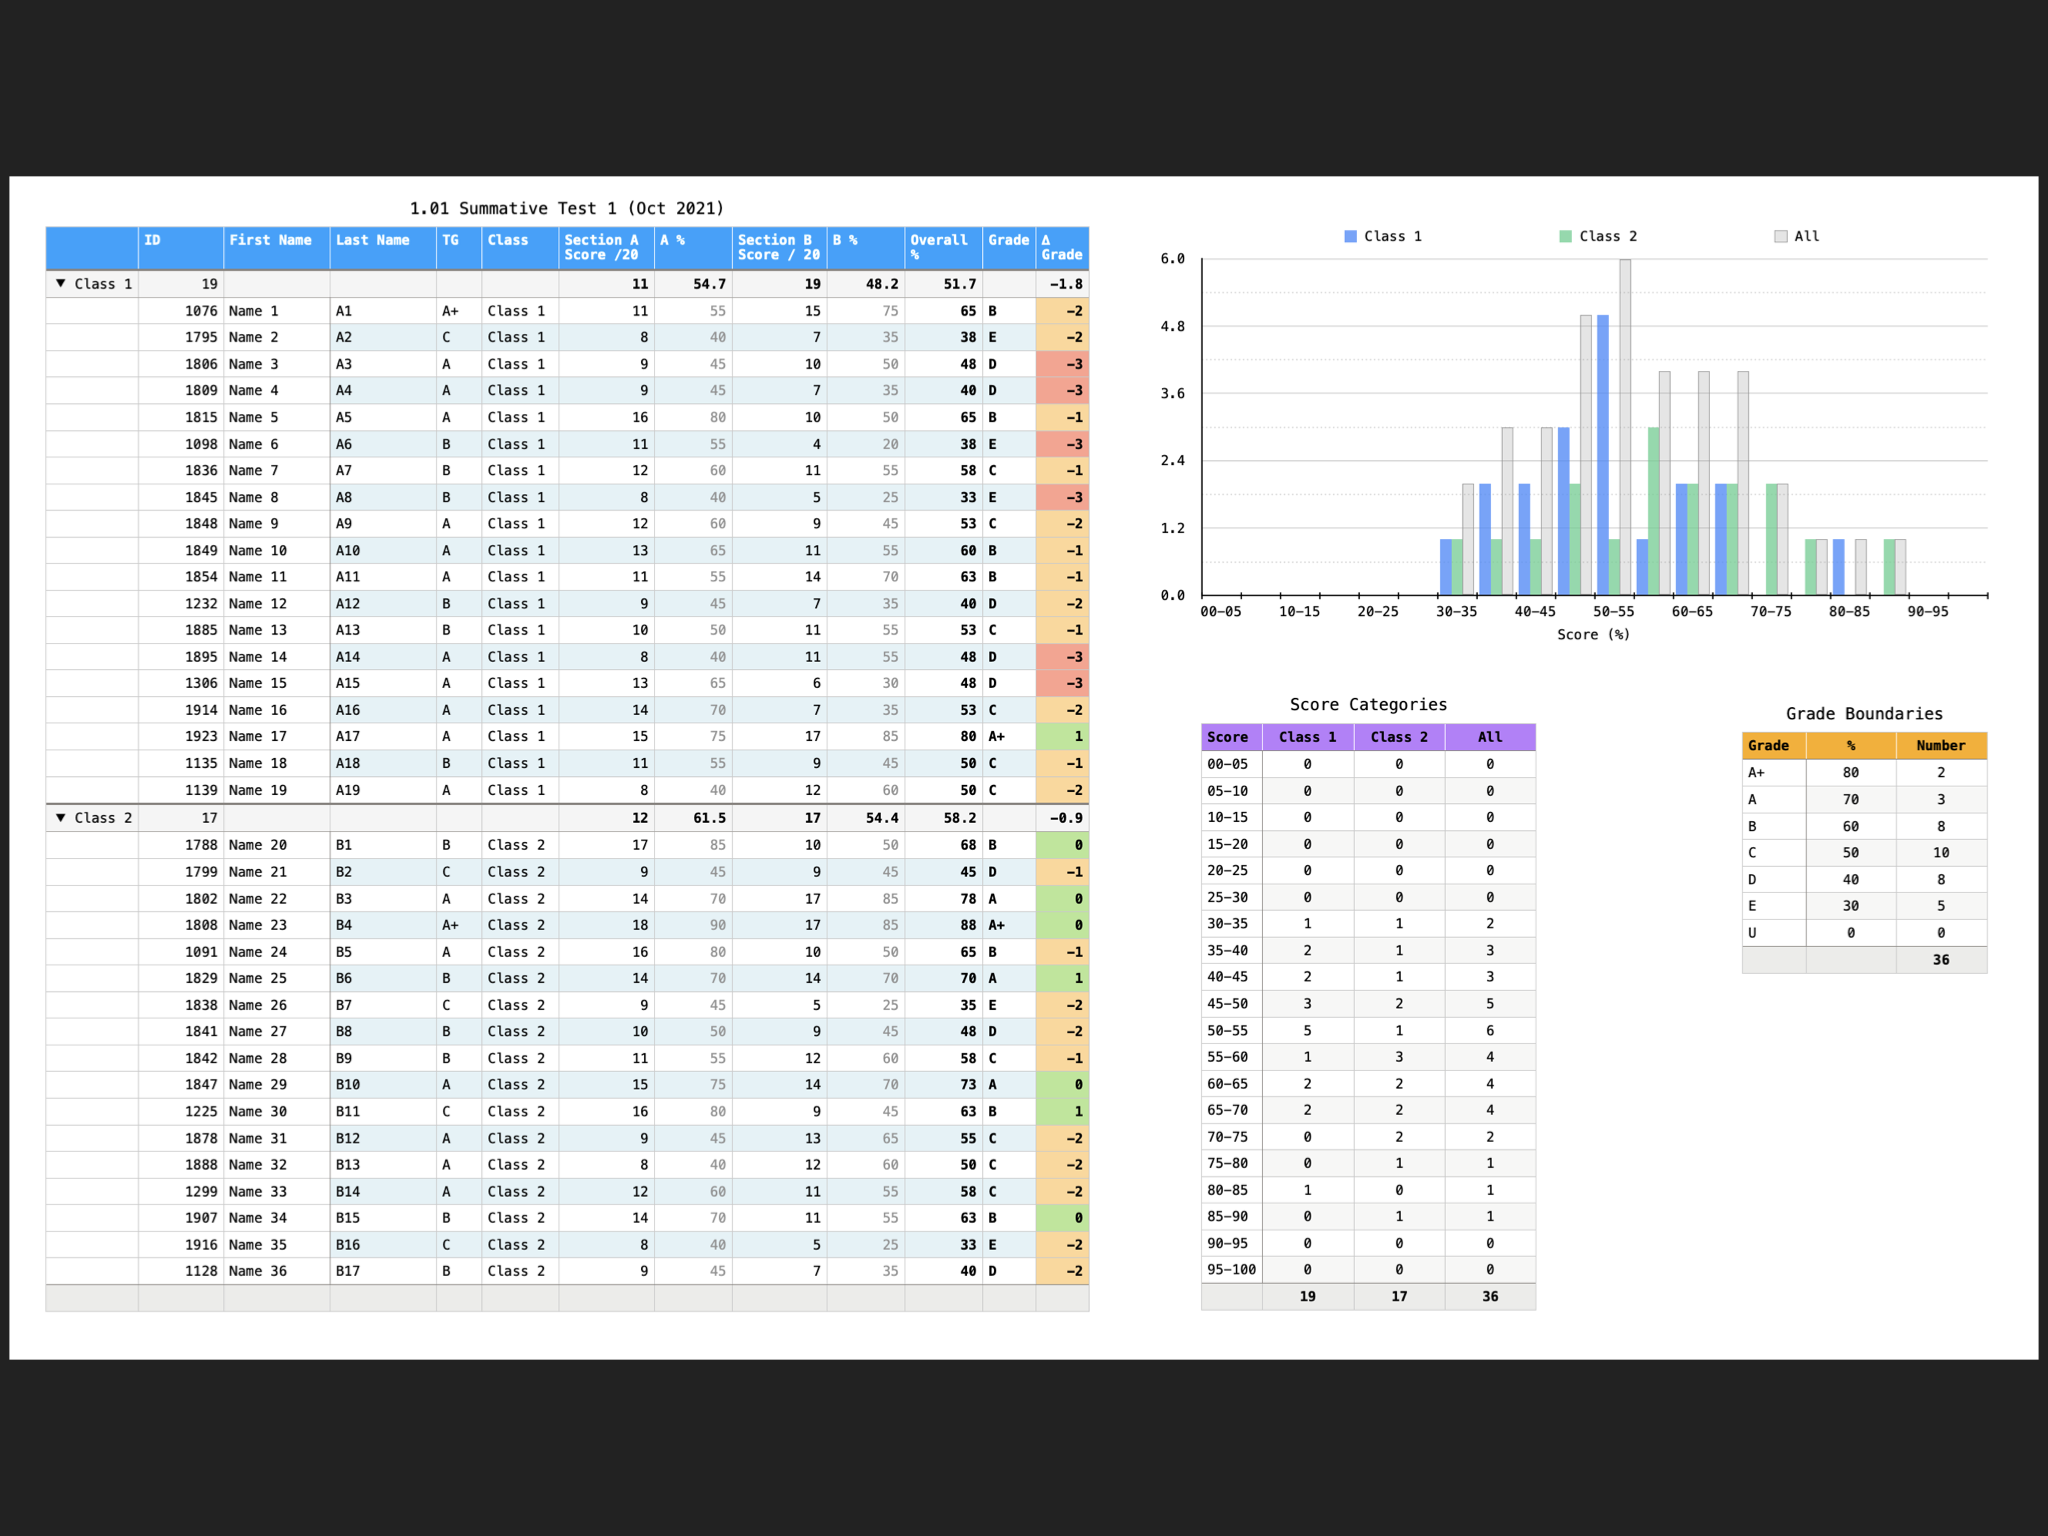
A Numbers ¹ spreadsheet that provides teachers with an attractive interface to record and analyse students\' grades. Capable of tracking results for up to three classes in the same subject (and can easily be edited to extend for more classes).
Scores can be recorded from two separate sections independently if desired. Grade boundaries are set per assessment in the designated table. Graphs show % scores in 5% range categories and the grade distribution.
In the main table achieved grades are compared with target grades and class average deviation from targets are also computed.
If you need to take your assessment analysis to the next level and track student progress over time I recommend my Assessment Tracker Spreadsheet. This enables you to track progress across up to six assessments, you can add custom weighting to the overall score to give added weight to recent scores reflecting improvement with time. Additionally bubble charts can help shed light on gaps in knowledge. Assessment Tracker Spreadsheet is a paid for item available on TES (TES account required).
DOWNLOAD Assessment-Spreadsheet
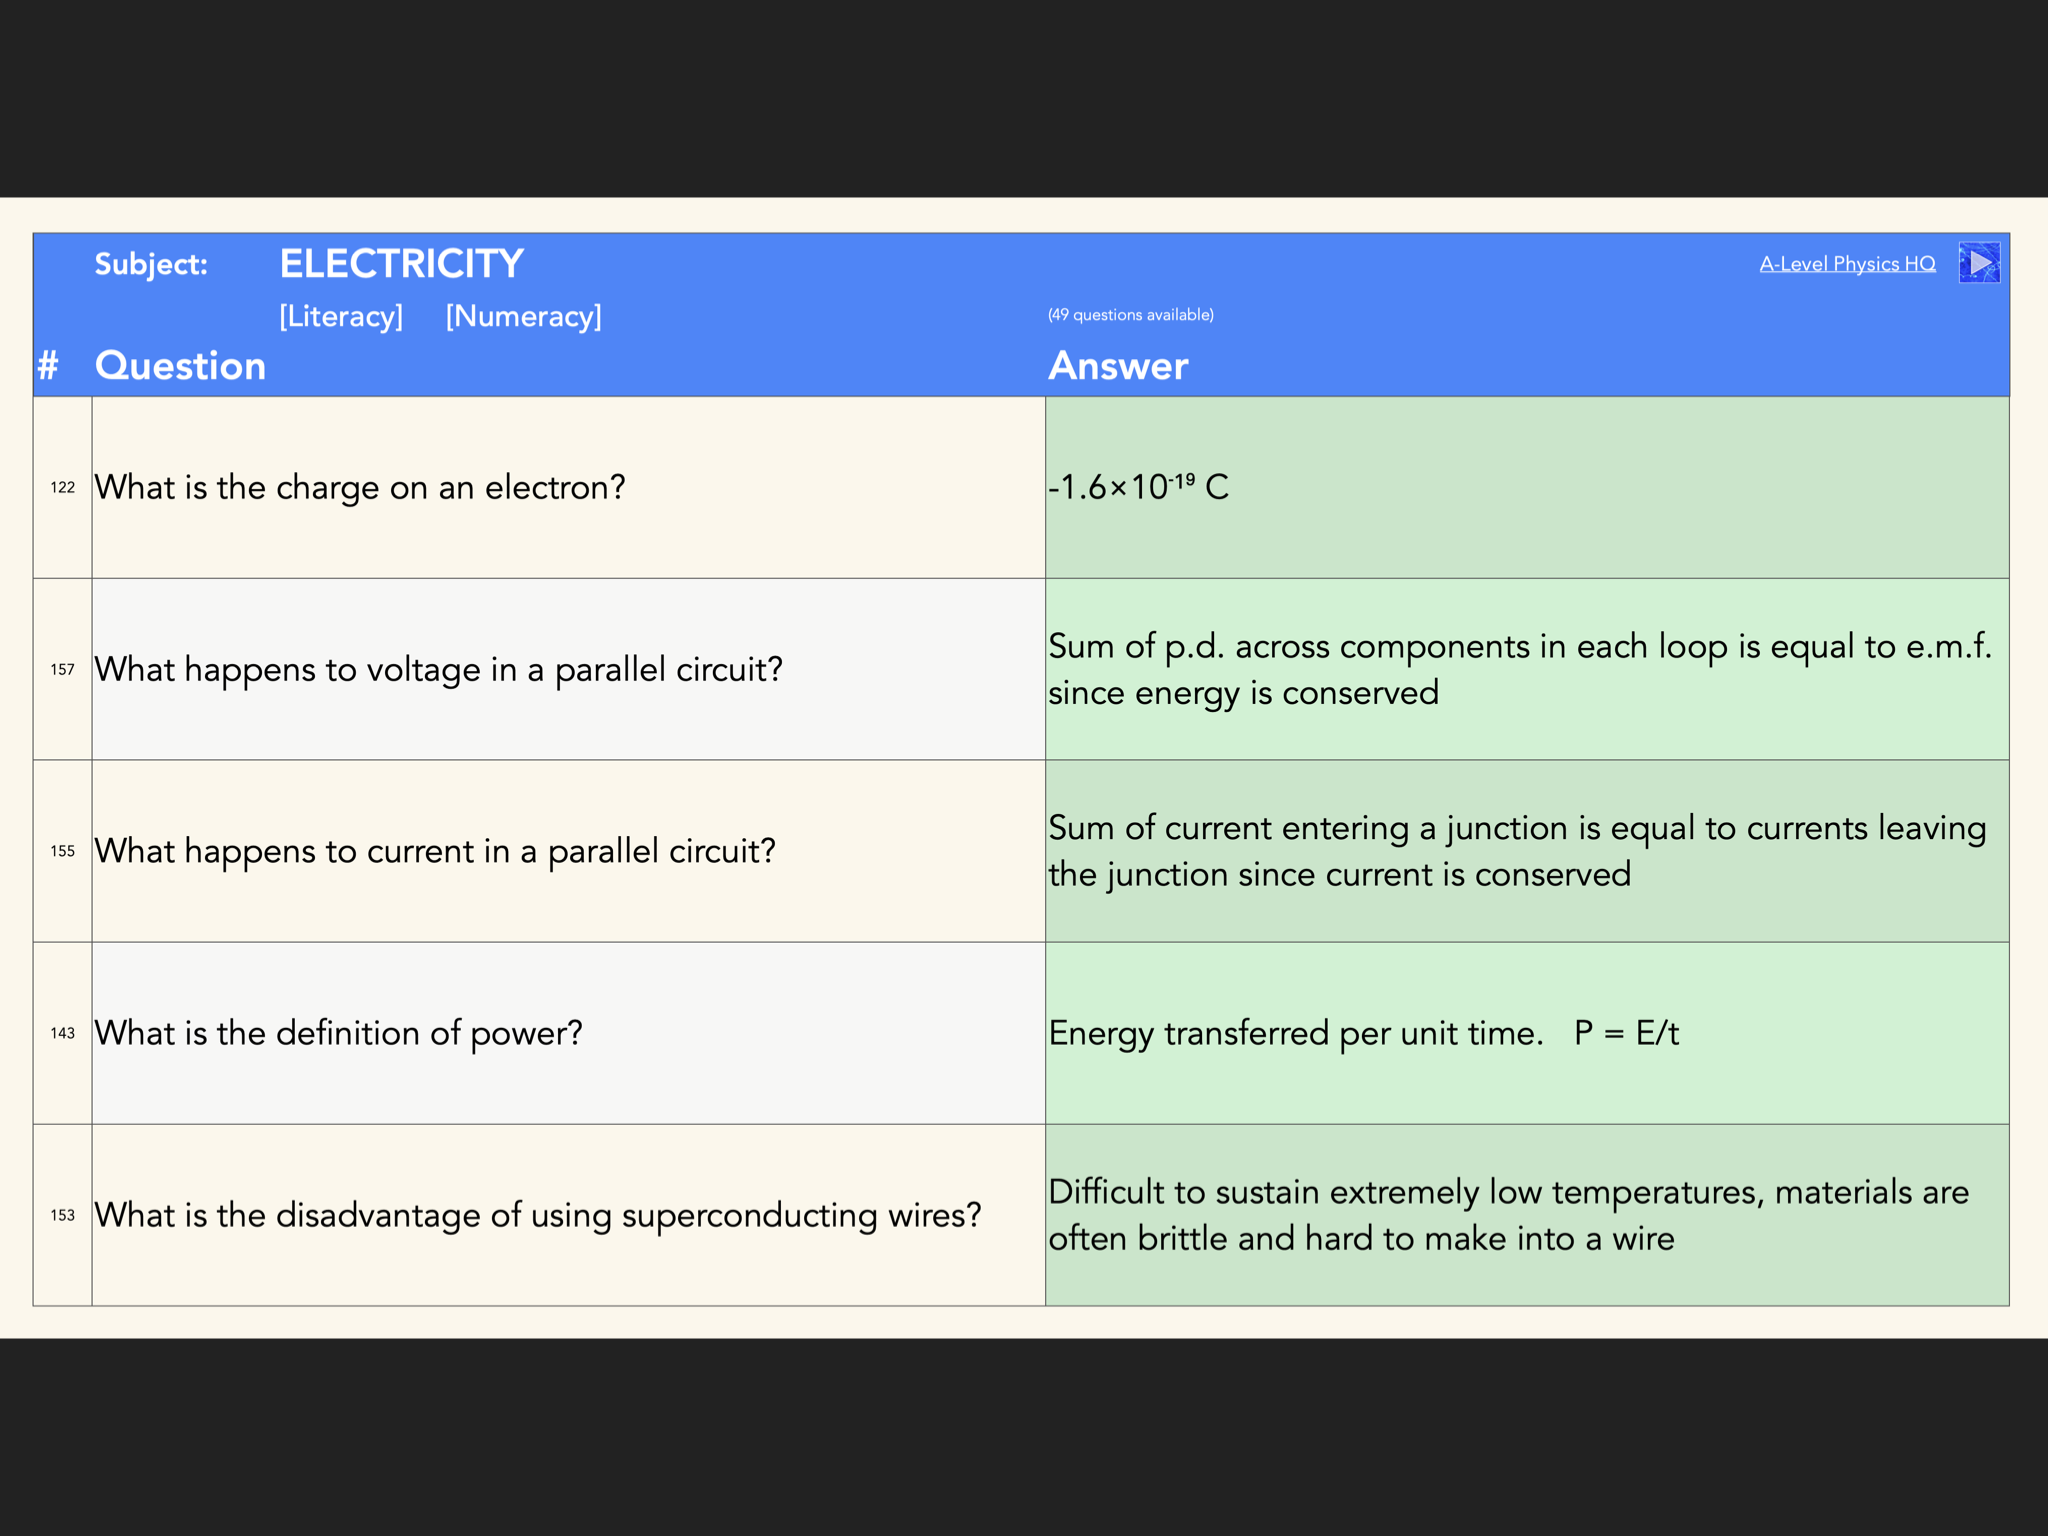
I use this generator extensively for continual revision throughout the school year. Each lesson we have a 5-10 minute quiz on past topics to keep them fresh in students’ minds. This is one of Rosenshine’s key principles.
Generate a recap / review quiz on a subject in physics with ease. Comes with a database of questions categorised into topic areas (physics subjects), you just select the topic area you want a quiz for and you’ll immediately get a mini quiz of five questions. When the class has finished attempting the questions click once to reveal the solutions. Want to cycle the questions for a new quiz? Check a checkbox and boom you’ve got a new quiz on the same topic area.
This is an entirely offline solution meaning you can use this even when your school’s internet connection drops out. The supplied questions are categorised as literacy or numeracy (where applicable). And those linked skills are displayed to the class to reinforce that the mini quiz includes those skills.
The master sheet has a single database of questions to make question maintenance a breeze - one place to input / edit questions. All lookup formulae are dynamic so that you don’t have to worry about which order the questions are in - so feel free to change the order of questions or add/remove questions as you see fit. The master database also harnesses Numbers’ built in categorisation on the subject so you can expand and collapse collections of questions easily - once again maintaining the database is made super easy.
The quiz generator is designed to randomly select five questions from the database. But note that for subjects with a small number of questions in the database duplicate questions may occasionally be shown. If you can try to keep numbers of questions above 15 to reduce the likelihood of this.
This is a Numbers ¹ spreadsheet.
Buy A-Level Physics Quiz Generator Spreadsheet [TES]
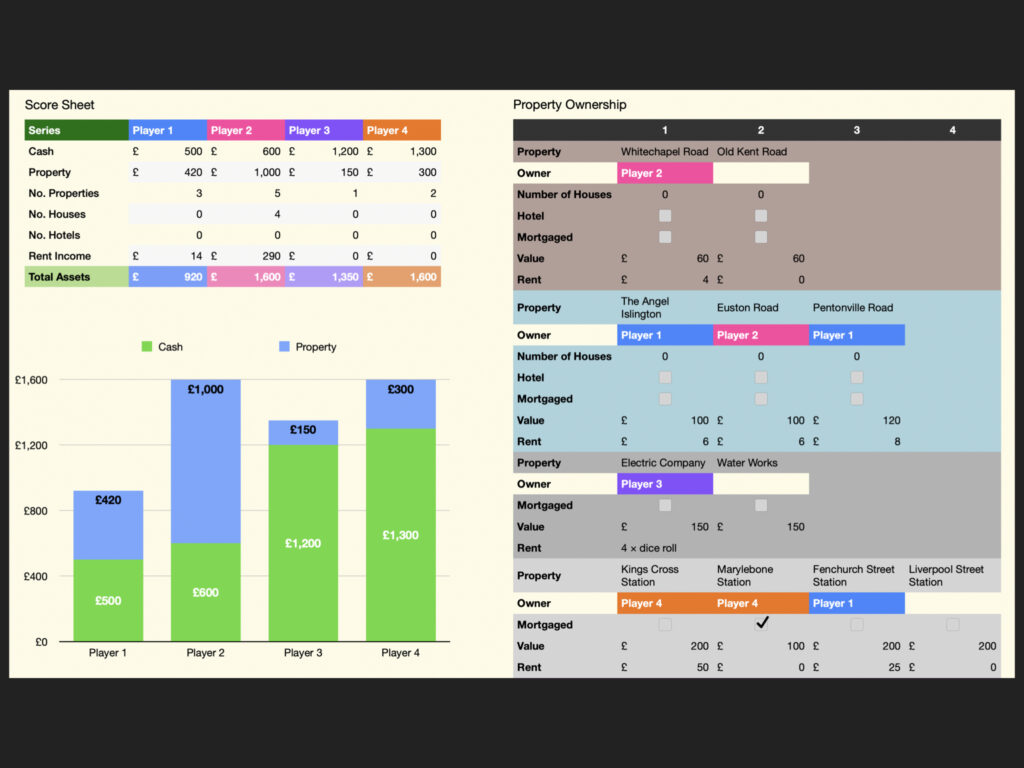
Track property purchases and house and hotel building and see player value at a glance. Optionally use the Scoring & Rental sheet to see the rent payable on any property.
This is a Numbers ¹ spreadsheet. It has property values and rental amounts for the original UK version. If playing a different version of the game update the Property Details table and the property names in the scoring sheet.
DOWNLOAD Monopoly Scorer
¹ Numbers is spreadsheet software made by Apple, it opens with the Numbers app available for free with most recent iPhone / iPad / Mac devices also available with a free Apple ID for use in most web browsers.